


There are various monitoring tools such as Spunk, ELK, Zabbix, CloudWatch, Prometheus, etc.
About Nagios-
Nagios is an open-source software for continuous monitoring of systems networks and infrastructure it runs plugins stored on a server that is connected with a host or another server on your network or the Internet in case of any failure Nagios alerts about the issues so that the technical team can perform recovery process immediately.
History of Nagios-
In the year 1999, Ethan Galsatd developed it as a part of Netsaint distribution.
2002, Ethan renames the project to "Nagios" because of trademark issues with the name Netsaint.
2009, Nagios releases its first commercial version Nagios XI
2012, Nagios was again renamed at Nagios core.
It uses port number 5666, 5667 and 5668 to monitor its client.
WHY Nagios?
Detects all types of network or server issues.
Helps you to find the root cause of the problem which allows you to get a permanent solution to the problem.
Reduces downtime.
Active monitoring of the entire infrastructure.
Allows you to monitor and troubleshoot server performance issues.
Automatically fixes the problem.
Features of Nagios-
oldest and latest.
Good log and database system.
Informative and attractive web interface.
Automatically send alerts if the condition changes.
Helps you to detect network errors or server crashing.
You can monitor the entire business process and IT infrastructure with a single pass.
Monitor network services like HTTP, SMTP, SNMP, SFTP, SSH, POP, DNS, LDAP,etc.
Phases of Continuos monitoring-
Define- Developer monitoring strategy
Establish- How frequently you are going to monitor it
Implement
Analyse data and report findings
Respond
Review and update
Nagios Architecture-
Nagios is a client-server architecture. Usually, a network or Nagios server is running on the host and plugins are running on the remote host which you want to monitor.
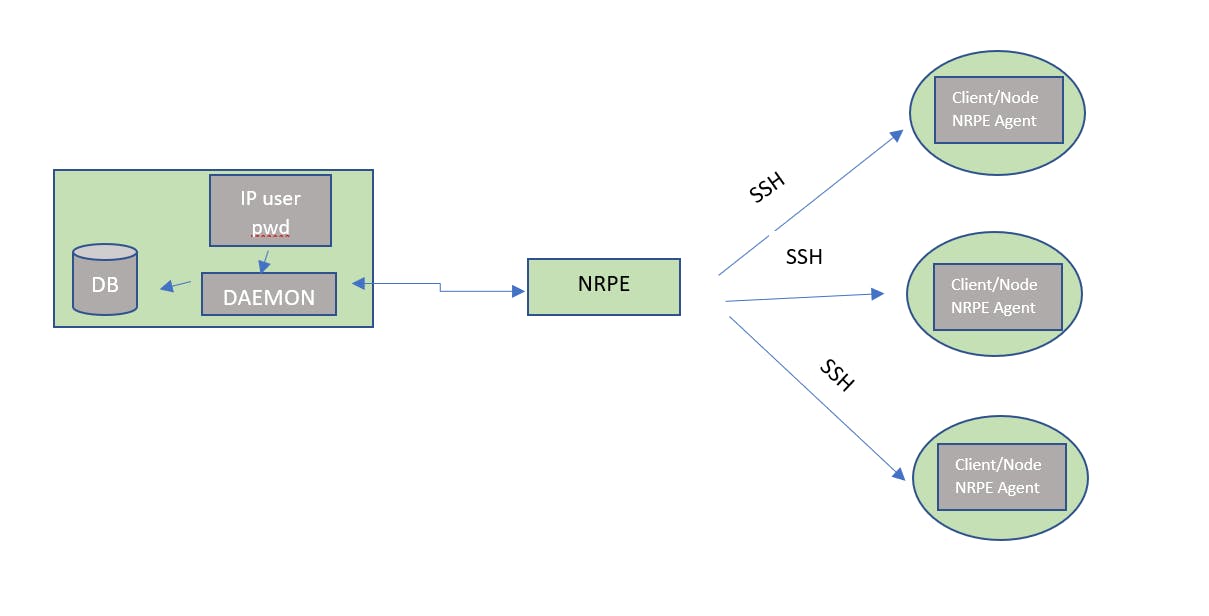
How does it work?
Mention all the details in configuration files.
Daemon read all those details about what data is to be collected.
Daemon uses NRPE plugin to collect data from nodes and store it in its database.
Finally shows everything on the dashboard.
Pre-requisites-
httpd (web server)
php (dashboard)
gcc and gd (compiler)
makefile (to build)
perl (script)